
Configuring dotnet-monitor with Prometheus and Grafana
Everyone likes dashboards! So let’s make one! dotnet-monitor was announced last year as an experimental tool for exposing REST endpoints to make diagnostics/measuring of your apps simpler. It could be seen as a “simple” ASP.NET Core app that wraps Diagnostic IPC Protocol to communicate with the target .NET application - exactly the same which is used when we use CLI Diagnostic tools like dotnet-trace or dotnet-counters. I personally perceive it simply as the REST wrapper for those tools. So, for example, we have /trace endpoint to start a session or /logs endpoint to capture logs. And finally, very recently dotnet-trace was announced as production-ready part of .NET 6 😍
But we are interested in /metrics endpoint. As the docs says, it “captures a snapshot of metrics of the default process in the Prometheus exposition format“. Awesome! BTW, it’s pretty simple format so such endpoint returns text data like:
# HELP systemruntime_cpu_usage_ratio CPU Usage
# TYPE systemruntime_cpu_usage_ratio gauge
systemruntime_cpu_usage_ratio 0 1632929076109
systemruntime_cpu_usage_ratio 0 1632929076111
systemruntime_cpu_usage_ratio 0 1632929086110
# HELP systemruntime_working_set_bytes Working Set
# TYPE systemruntime_working_set_bytes gauge
systemruntime_working_set_bytes 1529000000 1632929066112
systemruntime_working_set_bytes 1529000000 1632929076110
systemruntime_working_set_bytes 1529000000 1632929076112
...
# HELP systemruntime_time_in_gc_ratio % Time in GC since last GC
# TYPE systemruntime_time_in_gc_ratio gauge
systemruntime_time_in_gc_ratio 0 1632929066112
systemruntime_time_in_gc_ratio 0 1632929076110
systemruntime_time_in_gc_ratio 0 1632929076112
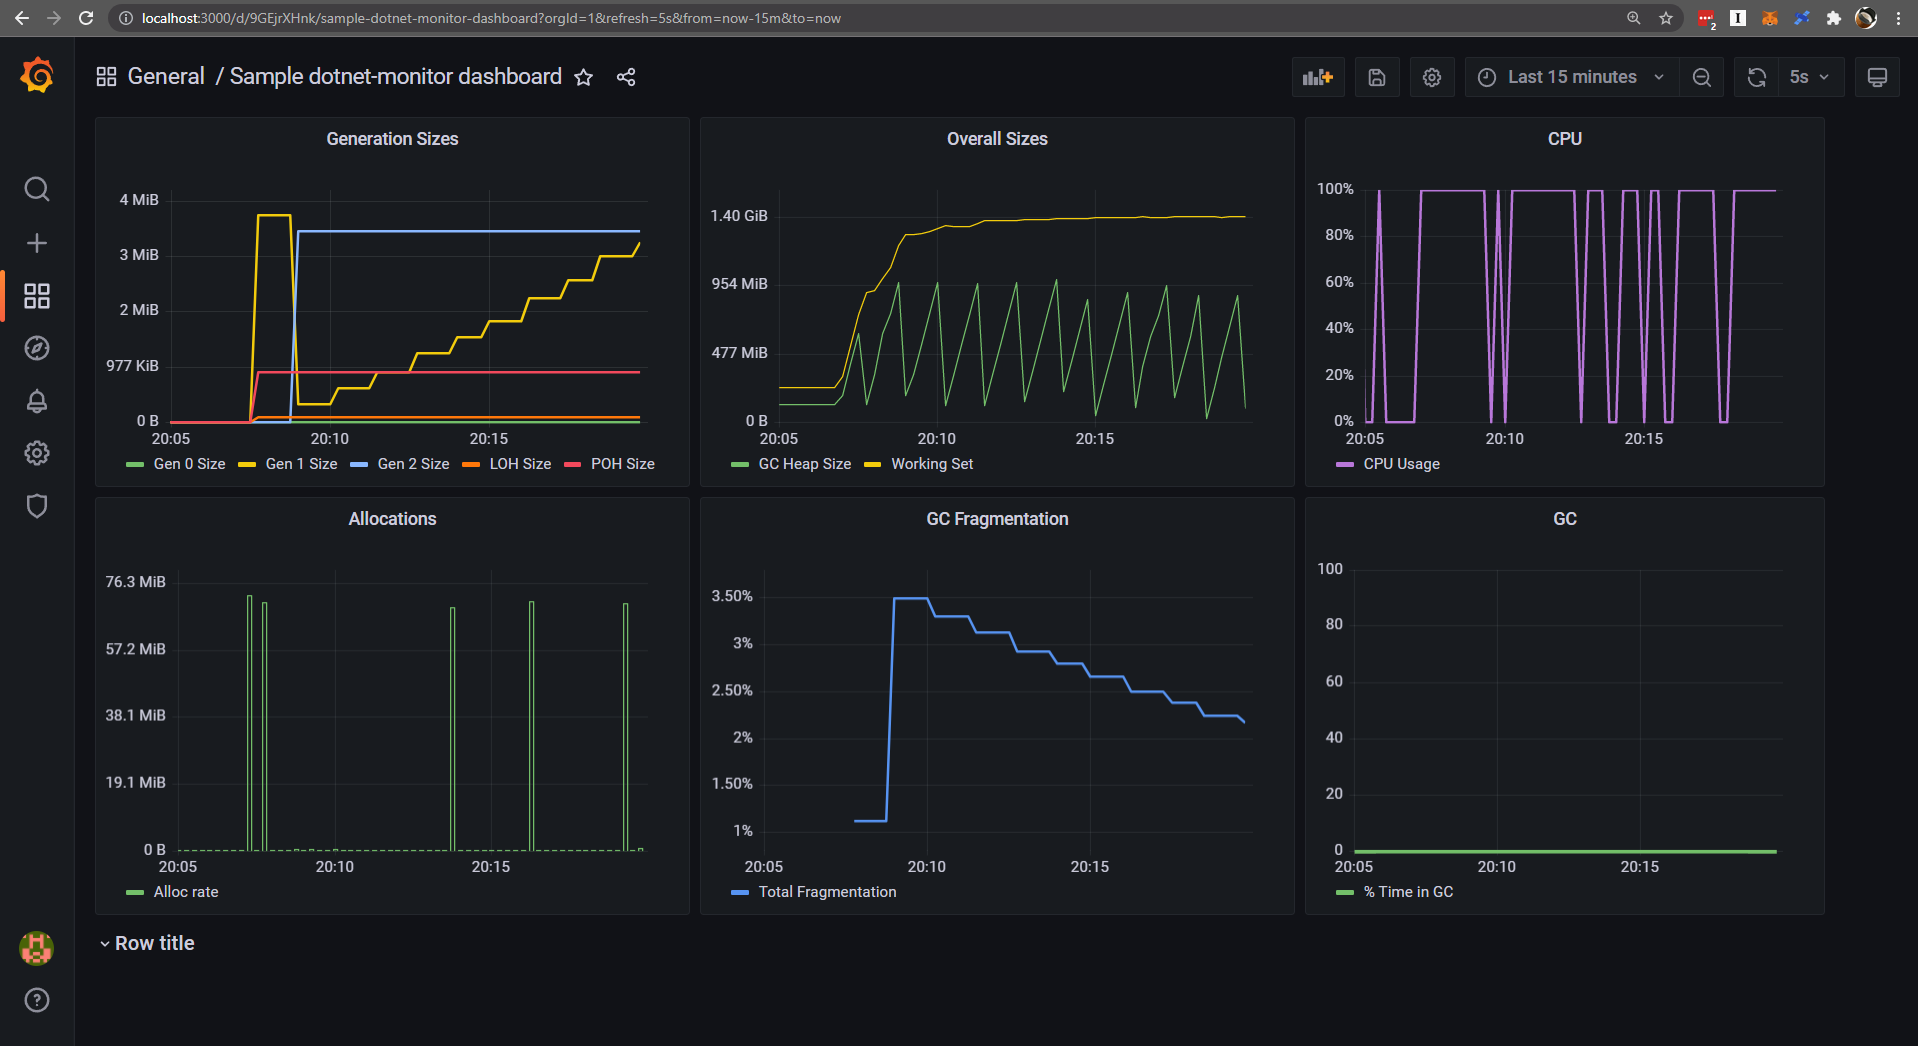
We simply see here all System.Runtime counters (the same as observed by dotnet-counters) with their values. Having said all that, let’s see how we can configure all necessary pieces together to have a working Grafana dashboard with some GC metrics👀.
Step 1 - Preparing the app
Let’s use memoryleak .NET 5 app by Sébastien Ros as I love it and I’m using it a lot in our .NET Memory Expert course - because of its self-measuring capabilities. So, just do:
❯ git clone https://github.com/sebastienros/memoryleak.git
… and we are almost ready! To make things more clean and fun, I will put this app into a container using Docker. So, here’s my sample Dockerfile for doing it (and I add procps just as an example that you can😇):
# https://hub.docker.com/_/microsoft-dotnet
FROM mcr.microsoft.com/dotnet/sdk:5.0 AS build
WORKDIR /source

COPY . .
RUN dotnet restore
RUN dotnet publish -c release -o /app --no-restore

# final stage/image
FROM mcr.microsoft.com/dotnet/aspnet:5.0
RUN apt-get update && apt-get install -y procps
WORKDIR /app
COPY --from=build /app .
ENTRYPOINT ["dotnet", "MemoryLeak.dll"]
Then build it:
❯ docker build --pull -t memoryleak-image -f Dockerfile .
Because we will be running dotnet-monitor from a sidecar container, we need to have some shared volume to represent /tmp folder (used by the IPC communication protocol), so let’s create one:
❯ docker volume create dotnet-tmp
And now we are ready to run our image, mount the shared volume and expose its 80 port as port 5000:
❯ docker run -it --rm -p 5000:80 --mount "source=dotnet-tmp,target=/tmp" memoryleak-image
Now, you should be able to visit http://localhost:5000/ to see the app drawing its own memory usage.
Step 2 - dotnet-monitor
We can install dotnet-monitor as a global tool, but let’s stay with containers. There is up and ready container image available on Microsoft Container Registry so it is as easy as the following command:
❯ docker run -it --rm -p 52323:52323 --mount "source=dotnet-tmp,target=/tmp" \
             mcr.microsoft.com/dotnet/monitor --urls http://*:52323 --no-auth
Note we are mounting here the same shared volume to have IPC communication possible. Now http://localhost:52323/processes should print only a single process with pid = 1 because it is observing the application container thanks to the shared /tmp volume. And http://localhost:52323/metrics should return similar metrics like presented before. BTW, I’m using --no-auth just to get rid of any authentication/certificates issues for such a simple demo.
Step 3 - Prometheus
Prometheus is a free monitoring system and time series database. We need it to consume just prepared /metrics endpoint and store results in it. Again, we could run/install Prometheus in a various ways but let’s go funny and use container again. First of all, we need a configuration file, let’s call it prometheus.yml:
global:
  scrape_interval: 15s
  scrape_timeout: 10s
  evaluation_interval: 15s
alerting:
  alertmanagers:
  - scheme: http
    timeout: 10s
    api_version: v1
    static_configs:
    - targets: []
scrape_configs:
- job_name: prometheus
  honor_timestamps: true
  scrape_interval: 15s
  scrape_timeout: 10s
  metrics_path: /metrics
  scheme: http
  static_configs:
  - targets:
    - localhost:9090
- job_name: memoryleak
  honor_timestamps: true
  scrape_interval: 2s
  scrape_timeout: 2s
  metrics_path: /metrics
  scheme: http
  static_configs:
  - targets:
    - host.docker.internal:52323
Nothing magical is happening here. Most important parts are the last 9 lines - configuring the job memoryleak that scrapes the http://host.docker.internal:52323/metrics endpoint every 2 seconds. The magical host.docker.internal hostname allows to communicate from one container to another container exposed on localhost. This is networking stuff and for sure it would be done differently on real setup. Good enough for a demo.
Prometheus is available as ubuntu/prometheus image, so let’s use it! Having configuration file we need to map it to the internal /etc/prometheus/prometheus.yml so the final command for running it is:
❯ docker run -d --name prometheus-container -e TZ=UTC -p 30090:9090 \
         -v c:\your\path\to\prometheus.yml:/etc/prometheus/prometheus.yml ubuntu/prometheus
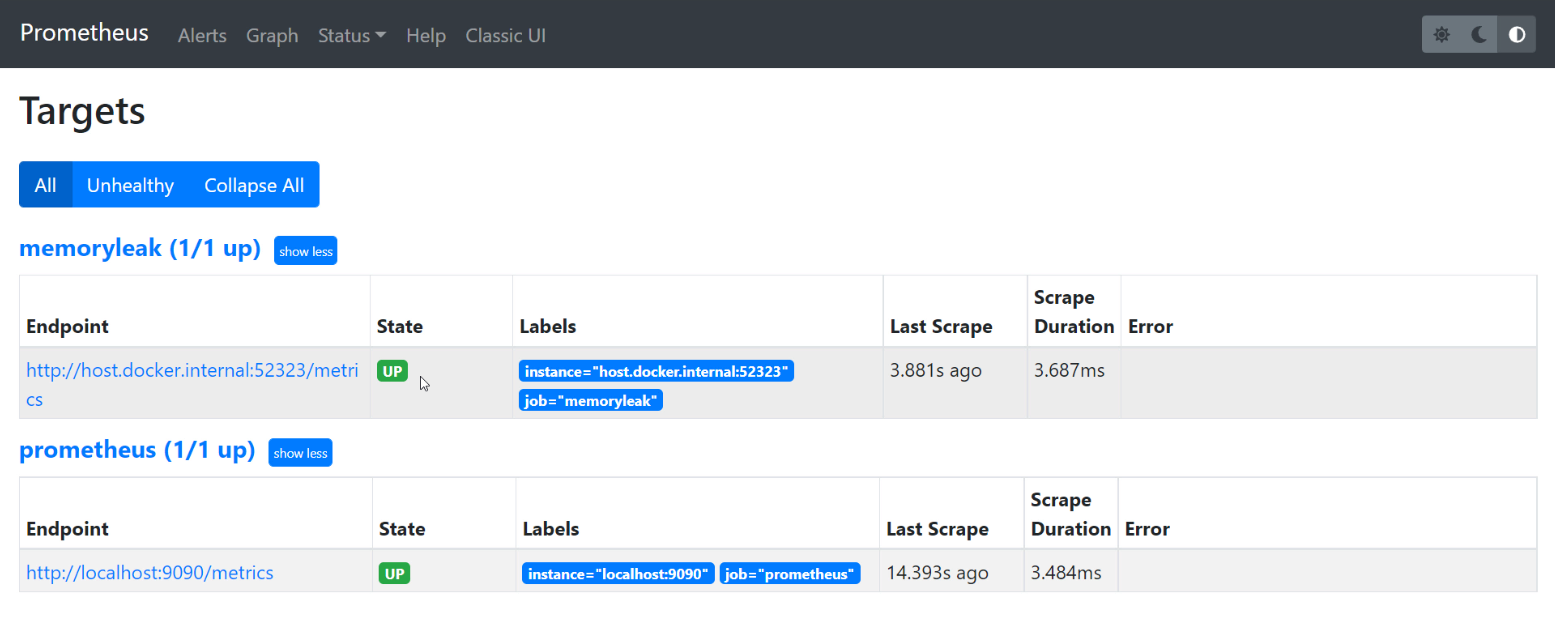
And… that’s it! Go to the http://localhost:30090/ and you will see Prometheus dashboard. By going to Status/Targets you should see Up state for the defined target:
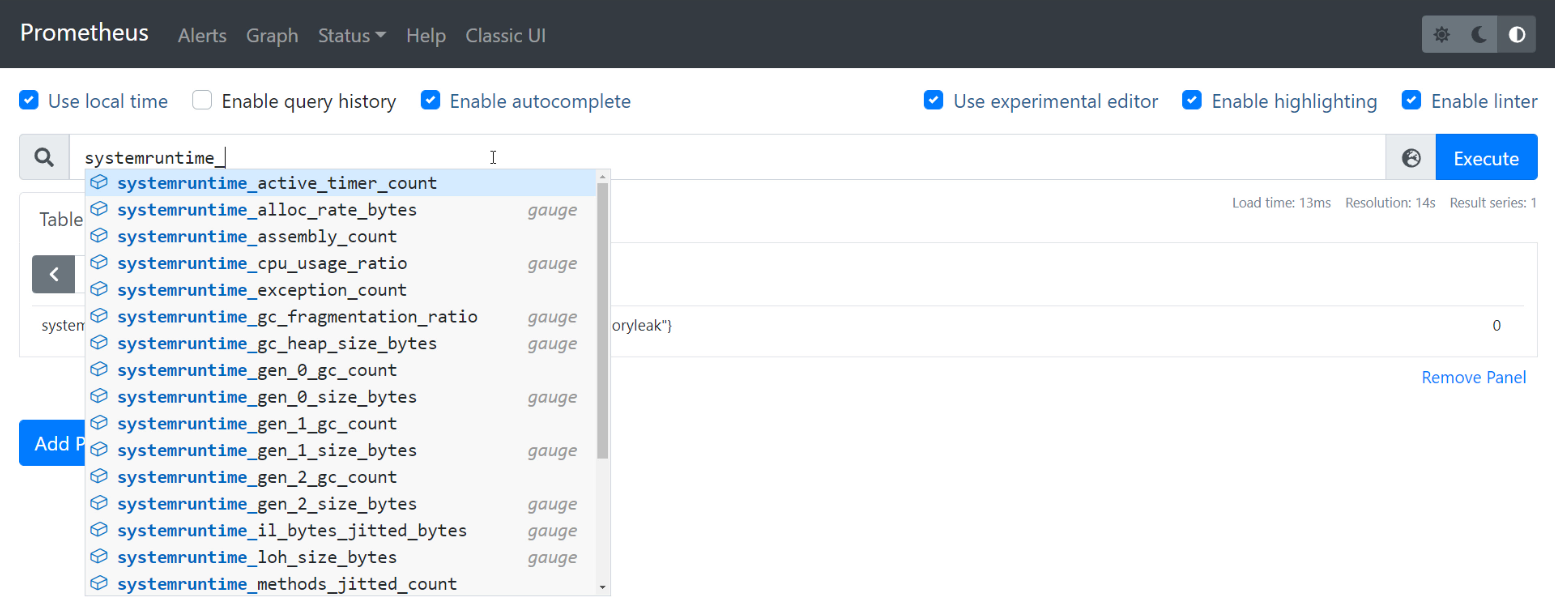
And on the Table/Graph panel you can sneak peak into the gathered measurements, for example by typing systemruntime_ to see the suggestions for all recorded metrics:
Step 4 - Grafana
And eventually, Grafana itself 😍 Let’s use the prepared image again:
❯ docker run -d -p 3000:3000 grafana/grafana
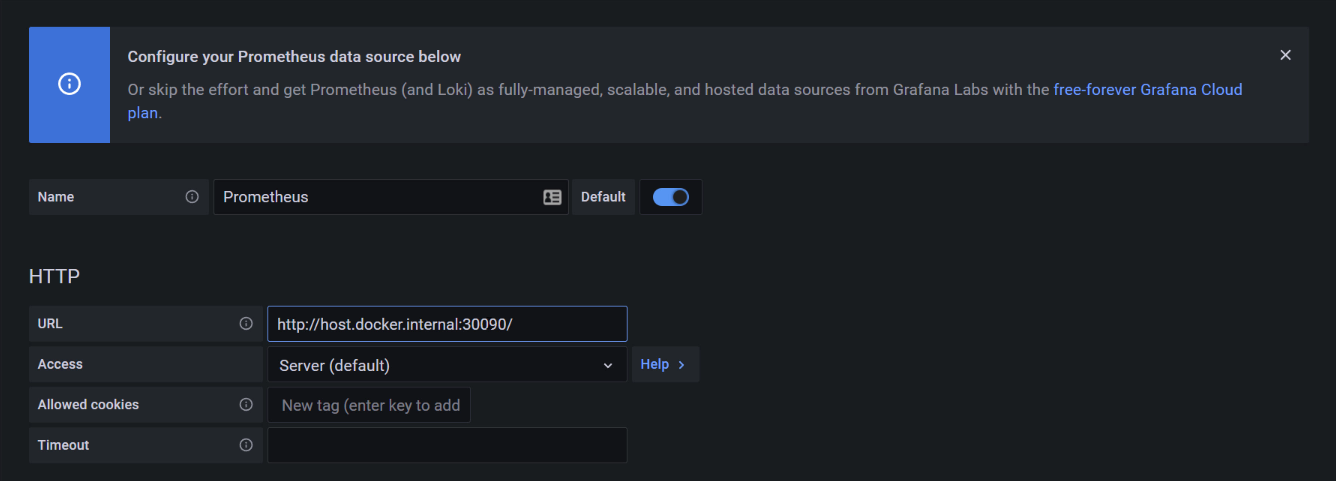
After going to http://localhost:3000/ you need to login as admin/admin. Then go to the Configuration/Add data source and add Prometheus endpoint as one of the sources:
- set URL to
http://host.docker.internal:30090/ - leave everything else as default
- click Save & test
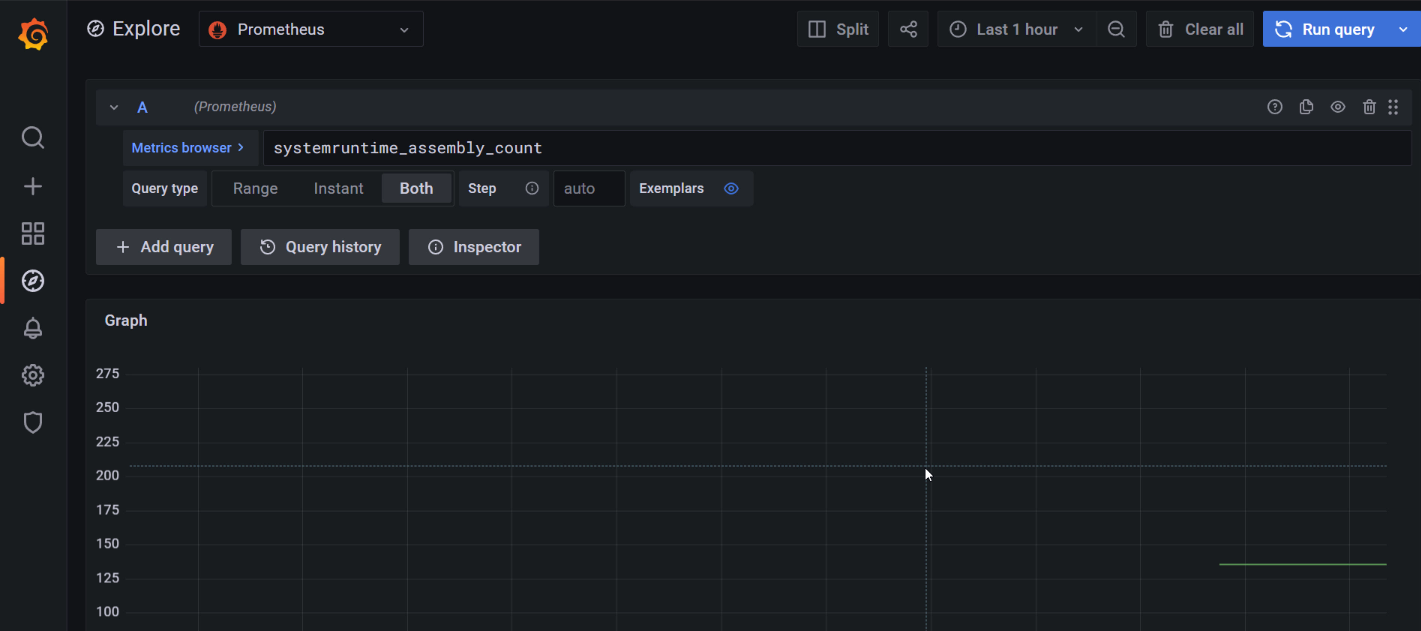
Now we are ready to Explore. As a Metric browser start typing again systemruntime… and you should see the suggestions of already available metrics:
And… that’s it! Everything is ready. Obviously, what we would like to achieve is to have a nice dashboard(s), so we need to create one. This is not the article about creating dashboards for sure. You can find many tutorials out there. To leave you with something useful, here’s a JSON file you can import in Dashboards/Import to have such a nice graphs as at the beginning of the article:
sample-dotnet-monitor dashboard.json
Have a nice dashboarding!
PS. For me it is just mindblowing how containerization and .NET on Linux makes it all possible 🤯 We have four containers that can run on Windows that run Ubuntu - one for .NET 5 app, one for dotnet-monitor, one for Prometheus and one for Grafana. And it all just works!💜